Mosaic Processing on LinkedIn
Understanding the Numbers at the Top of Your Processing Cost Comparison

A good processing cost comparison should not make a business owner search through pages of data to find the most important information.
That is why the summary section of Mosaic Processing’s Cost Comparison presents five key figures immediately:
- Total processing volume
- Average ticket
- Estimated monthly savings
- Estimated annual savings
- Estimated three-year savings
Together, these numbers provide a quick overview of the business’s recent processing activity and the potential financial impact of the proposed pricing.
The figures are simple to read, but each one tells an important part of the story.
Total Processing Volume: The Foundation of the Comparison
Total processing volume represents the dollar amount of card transactions included in the statement period being analyzed.
This establishes the size of the merchant’s payment activity and provides the foundation for the rest of the comparison.
Processing volume matters because many payment costs are percentage-based. A small difference in processor markup may appear insignificant when viewed as a fraction of a percentage point, but that difference can become meaningful when applied across substantial monthly volume.
For example, a reduction of 0.20% represents:
- $20 on $10,000 in processing volume
- $200 on $100,000 in processing volume
- $2,000 on $1 million in processing volume
The percentage does not change, but its financial impact grows with the business.
The summary also shows the number of transactions processed during the period. Volume and transaction count must be considered together because processing costs may include both percentage-based charges and per-transaction fees.
Two businesses could each process $100,000 per month but have very different costs if one completes 500 transactions and the other completes 5,000.
Average Ticket: Understanding the Typical Transaction
The average ticket is the average dollar amount of each transaction.
It is calculated using a simple formula:
Total processing volume ÷ number of transactions = average ticket
Average ticket helps explain how percentage-based pricing and per-item fees affect the merchant.
Consider two businesses that each process the same monthly volume:
- A professional service firm may process a small number of large payments.
- A quick-service retailer may process thousands of smaller transactions.
The retailer’s per-transaction fees may have a much greater impact because those fees are applied many more times.
The professional service firm may be more sensitive to percentage-based processor markup because each transaction carries a higher dollar value.
Neither pricing structure is automatically better for every merchant. The right structure depends on how the business actually processes payments.
That is why Mosaic does not evaluate volume alone. We also review transaction count and average ticket to understand the merchant’s full processing profile.
Estimated Monthly Savings: The Immediate Difference
Estimated monthly savings show the difference between the merchant’s current processing cost and the estimated cost under Mosaic’s proposed pricing.
The calculation is:
Current monthly processing cost − proposed monthly processing cost = estimated monthly savings
This estimate is not created by simply applying a promotional rate to total volume. It comes from repricing the activity shown on the merchant’s statement and comparing the resulting costs.
The analysis considers the expenses that would remain consistent, such as eligible interchange and card-brand costs, along with the processor-controlled charges that may change.
Those changes could include:
- Processor percentage markup
- Per-transaction fees
- Authorization charges
- Batch fees
- Monthly fees
- Gateway expenses
- Other processor-controlled costs
This allows the merchant to see not only how much the proposal may save, but also where the savings originate.
What “Lower Cost” Really Means
The percentage shown beneath the estimated monthly savings indicates how much lower the proposed total cost is compared with the current total cost for the period analyzed.
For example, if a merchant currently pays $2,700 per month and the proposed estimate is approximately $2,480, the difference is about $220.
That would represent a total cost reduction of roughly 8%.
This figure is different from a reduction in the effective rate or processor markup. It measures the estimated percentage reduction in the merchant’s total processing expense.
That distinction matters because payment pricing involves several different percentages:
- Interchange percentages
- Processor markup
- Effective rate
- Percentage reduction in total cost
A transparent comparison should label these figures clearly instead of treating them as interchangeable.
Estimated Annual Savings: Turning a Monthly Difference Into a Budget Number
Monthly savings can sound modest when considered in isolation. The annual projection shows what that difference could mean over a full year if similar activity continues.
The calculation is generally:
Estimated monthly savings × 12 = estimated annual savings
This gives the business a practical budgeting figure.
A company saving an estimated $200 per month could retain approximately $2,400 over a year. A business saving $500 per month could retain approximately $6,000.
That money could support:
- Employee wages and benefits
- Marketing
- Technology improvements
- Equipment purchases
- Inventory
- Professional services
- Facility expenses
- Cash reserves
Processing expenses may appear as one monthly line item, but their long-term effect can be meaningful.
Estimated Three-Year Savings: Showing the Long-Term Impact
The three-year estimate extends the annual projection across 36 months.
The basic calculation is:
Estimated monthly savings × 36 = estimated three-year savings
This figure helps owners and finance teams evaluate the cumulative impact of a pricing decision.
Processing agreements are not one-time purchases. Payment fees are incurred every day the business accepts cards. A seemingly small pricing difference repeats across every transaction, month, and year.
A business saving $250 per month could retain approximately $9,000 over three years. A merchant saving $1,000 per month could retain approximately $36,000.
The three-year projection helps put processor pricing into the same long-term context as other operating decisions.
These Are Projections, Not Guarantees
Annual and three-year savings figures are projections based on the statement activity being analyzed. They assume that processing behavior remains reasonably similar.
Actual results may change if the business experiences changes in:
- Sales volume
- Number of transactions
- Average ticket
- Card mix
- In-person versus online activity
- Refunds or chargebacks
- Card-network pricing
- Business model or operating locations
- Processing technology
A growing business may process more than the original statement shows. A seasonal business may have major fluctuations throughout the year. A shift toward online payments may also change the transaction profile.
That does not make the projections less useful. It means they should be understood for what they are: estimates showing how the proposed pricing would perform if applied to activity similar to the period reviewed.
Why We Show Monthly, Annual, and Three-Year Figures
Different decision-makers evaluate expenses differently.
An owner may want to know the immediate monthly impact. A controller may be focused on annual budgeting. A CFO may consider the cumulative effect across a multi-year relationship.
Showing all three figures helps everyone understand the same proposal from the perspective most relevant to their responsibilities.
It also prevents a processor from presenting only the number that sounds most impressive.
The monthly estimate shows the underlying difference. The annual and three-year figures show how that monthly difference accumulates. All three should connect through straightforward math.
The Summary Is a Starting Point
The top of the comparison is designed to answer the first set of questions quickly:
- How much does the business process?
- How many transactions does it complete?
- What is its average ticket?
- What is the estimated monthly difference?
- What could that difference mean over time?
But the summary is not meant to replace the detailed analysis.
The sections that follow explain the current costs, proposed pricing, card-brand breakdown, processor markup, effective rate, and specific sources of the estimated savings.
The summary tells the merchant what the potential result may be. The supporting sections show how that result was calculated.
Clear Numbers Create Better Conversations
A processing proposal should not require a leap of faith.
The merchant should be able to connect its actual business activity to the proposed pricing and understand the potential impact in monthly, annual, and long-term terms.
That is what this summary section is designed to accomplish.
It converts payment-processing data into business information that owners and financial decision-makers can understand, question, and verify.
At Mosaic Processing, we believe a merchant should see more than a rate. It should see the full financial picture—and understand exactly what the numbers mean.
See what total volume, average ticket, and projected monthly, annual, and three-year savings reveal in a transparent processing cost comparison.

Digital Wallets 101: The Basics Every Merchant Should Understand
A customer taps a watch at the counter. Another checks out on a phone without typing a card number. Both are using digital wallets—and both want a simple, reliable way to pay.
For merchants, accepting digital wallets means understanding how they work, where they fit into checkout, and what they mean for payment costs and daily operations.
What Is a Digital Wallet?
A digital wallet lets customers store or access payment credentials electronically. Depending on the service, payments may draw from a credit card, debit card, prepaid card, linked bank account, or stored balance.
Familiar options include Apple Pay, Google Pay, PayPal, Venmo, and Cash App, although their features and merchant acceptance requirements differ.
Customers may use a wallet to:
- Pay in-store: Tap a compatible phone or smartwatch at a contactless payment terminal.
- Check out online: Select a supported wallet button instead of manually entering payment details.
- Pay within an app: Approve a purchase using a fingerprint, facial recognition, passcode, or another supported authentication method.
The goal is straightforward: make paying easier without requiring customers to pull out a physical card each time.
Why Digital Wallets Matter for Merchants
Less effort at checkout. Entering card numbers, expiration dates, and billing information can be cumbersome, especially on a phone. Wallet payments can remove some of those steps and make purchases easier to complete.
A familiar payment experience. Customers who already use a wallet may appreciate seeing it offered at your counter or on your website.
Additional protection for payment information. Many card-based wallets use tokenization, which substitutes a digital identifier for the actual card number. Apple Pay, for example, uses a device-specific account number and transaction-specific security code rather than sending the customer’s actual card number to the merchant. Apple’s security overview explains how this works.
These protections help safeguard payment credentials, but merchants still need appropriate fraud controls and procedures for handling disputes.
A Digital Wallet Does Not Automatically Mean Lower Fees
The wallet is how the customer initiates the payment. The underlying funding source may still be a credit or debit card.
Merchants should review how their provider prices each wallet option, including transaction fees and any additional service charges. Costs can differ by payment method and checkout product, as illustrated by PayPal’s merchant fee schedule.
The practical question is: Does this payment option offer a better checkout experience at a cost that makes sense for your business?
What Merchants Should Review
Wallet acceptance should work throughout the customer experience, from the first payment attempt to a refund.
Review these areas with your payment provider:
- In-store acceptance: Are terminals compatible with the contactless wallets you want to accept, and is the feature enabled?
- Online checkout: Are supported wallet buttons visible and working on eligible devices and browsers?
- Mobile performance: Can customers complete a purchase easily on a smaller screen?
- Processor and gateway support: Which wallets does your current setup support, and what requires a separate integration?
- Recurring payments: If you sell subscriptions or memberships, does the specific wallet integration support your billing needs?
- Refunds and disputes: Does your team understand how to locate transactions, issue refunds, and respond to customer questions?
- Reporting and reconciliation: Can you identify wallet transactions and match them to orders and deposits?
- Staff training: Can employees help when a wallet payment fails or a customer needs assistance?
Test actual purchases and refunds regularly, especially after updates to your website, payment software, or terminals.
What to Watch in 2026 and Beyond
Digital wallets connect familiar payment methods with newer checkout experiences. A customer may still be using the same card, but the way they present and approve the payment has changed.
Merchants should track the results where their reporting allows:
- How often customers choose a digital wallet.
- Whether wallet payments are approved successfully.
- Whether mobile shoppers complete checkout.
- How fees, refunds, and disputes compare across payment methods.
These details help businesses decide which options to support and where checkout needs improvement.
Make Checkout Easier to Complete
Digital wallets give customers another convenient way to pay. Their value depends on how well they work within your business.
Make supported options visible, test them regularly, understand the costs, and prepare your team to help customers.
Wondering whether your current payment setup supports the wallet options your customers want? Mosaic Processing can help you review your checkout experience, compatibility, and processing costs.
Digital wallets can simplify checkout in-store and online. Learn how they work, what they mean for payment security and processing costs, and what merchants should review to deliver a reliable customer experience.

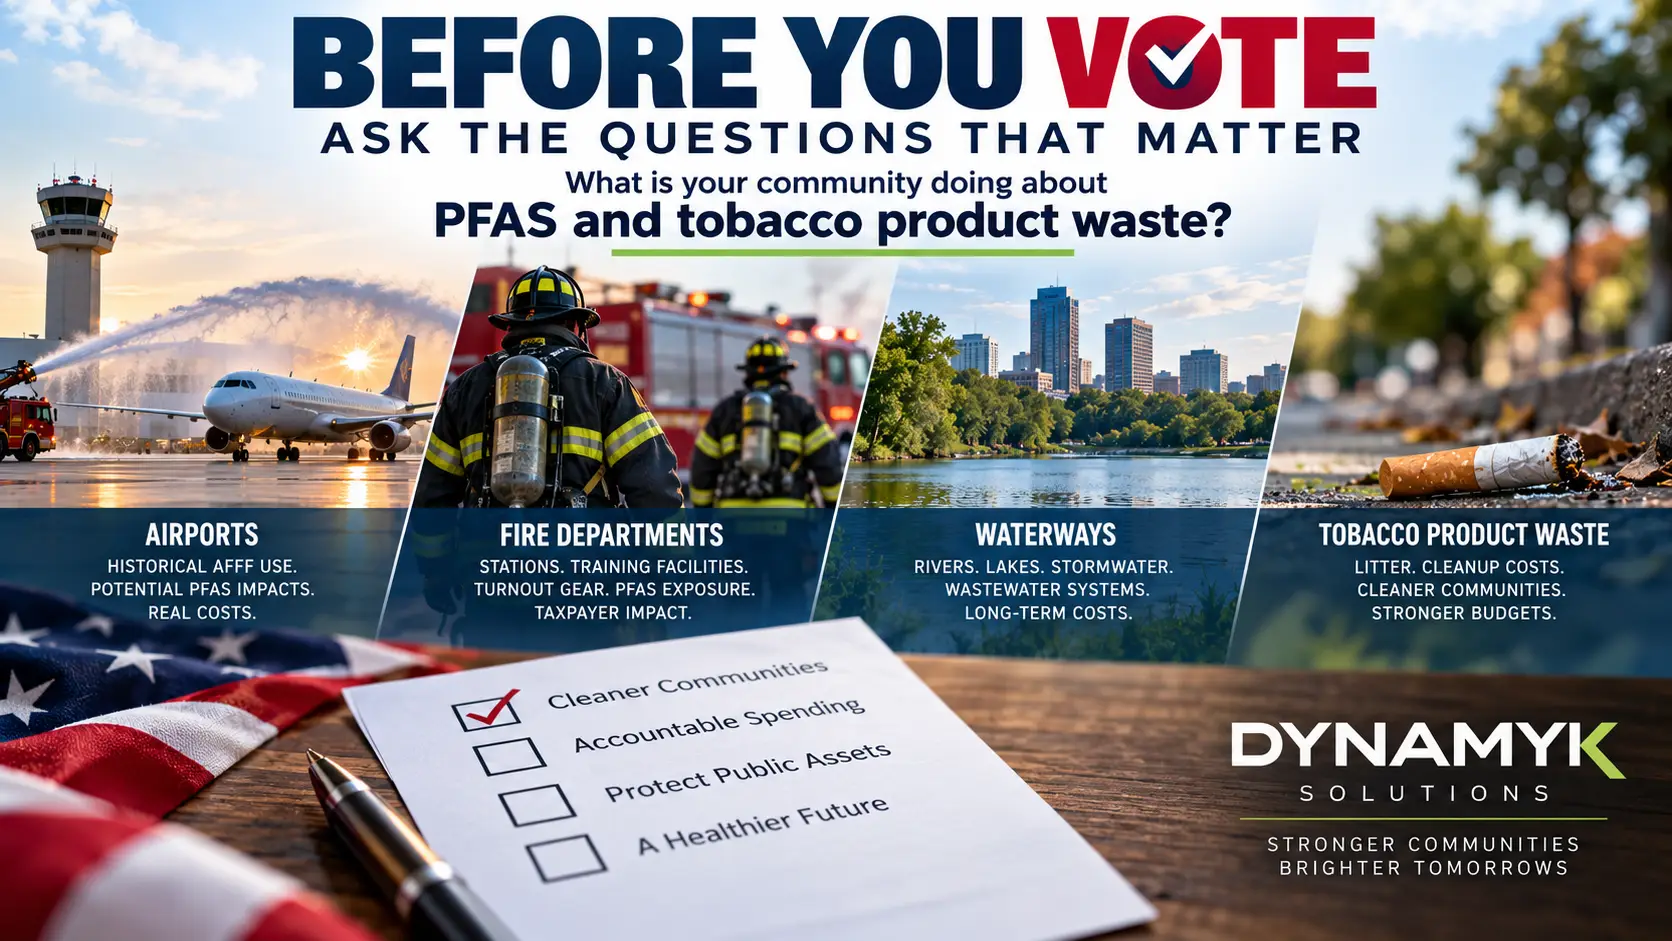
Before You Vote, Ask Candidates What They’re Doing About PFAS and Tobacco Product Waste
When election season arrives, candidates talk about taxes, public safety, infrastructure, economic development and the cost of living.
Those conversations matter.
But there are two issues voters should also be asking candidates about: PFAS contamination and tobacco product waste (TPW).
Whether someone is running for mayor, governor, city council, county board or another public office, there is a simple question worth asking:
What are you doing to identify these potential liabilities, protect public assets and make sure taxpayers aren’t unnecessarily left with the bill?
This isn’t about telling anyone how to vote.
It’s about asking candidates to explain how they would handle issues that could have significant environmental and financial consequences for the communities they want to lead.
PFAS: Look Beyond the Drinking-Water Tap
When most people hear about PFAS, they immediately think about drinking water.
That’s important, but the potential exposure for a municipality can extend much further.
For the communities Dynamyk Solutions has been working with, we believe elected officials should be looking closely at several major categories of publicly owned assets.
Airports
For decades, airports used AFFF firefighting foam to prepare for and respond to aircraft fires.
That historical use can create potential PFAS concerns at airports and surrounding properties.
For communities that own or share ownership of an airport, voters should be asking:
Has anyone investigated the airport’s historical AFFF use and potential PFAS exposure?
Does the airport have potential testing, remediation, replacement or other future costs?
Has the community explored whether qualifying costs could potentially be recovered rather than absorbed entirely by the airport and taxpayers?
An airport is one of a community’s most valuable public assets. Its potential PFAS exposure deserves attention from the people seeking responsibility for overseeing it.
Fire Departments and Firefighters
The same conversation belongs at the firehouse.
PFAS concerns can potentially involve fire stations, training facilities, historical AFFF use and firefighter turnout gear and equipment.
Firefighters spent years using products they were told were necessary to protect themselves and their communities.
Now communities should be asking what that history could mean financially and environmentally.
Candidates should be prepared to discuss questions such as:
Has our fire department evaluated historical AFFF use?
Have fire stations and training locations been considered as potential PFAS exposure sites?
What is the potential cost of replacing affected turnout gear and equipment?
Could taxpayers ultimately be responsible for those costs?
Has the community investigated potential recovery opportunities?
Supporting firefighters isn’t only about buying new equipment. It’s also about understanding why that equipment may need to be replaced and determining who should ultimately bear the cost.
Waterways, Stormwater and Wastewater
PFAS doesn’t necessarily remain where it was originally used.
That’s why the conversation also needs to include rivers, lakes, streams, stormwater infrastructure, wastewater systems and other waterways.
Communities can face costs associated with monitoring, testing, treatment, remediation, infrastructure and long-term environmental management.
Those costs can continue for years.
A mayor, governor, council member or other public official should understand that environmental contamination can also become a significant budget issue.
Residents should be asking:
What waterways and water-related public assets could be affected?
Are we testing and documenting potential impacts?
What could remediation or treatment cost over the next 10, 15 or 20 years?
And perhaps most importantly:
Are taxpayers automatically expected to pay for everything, or is the community investigating whether responsible parties may bear some of those costs?
Tobacco Product Waste Raises a Similar Question
Then look at sidewalks, streets, parks, parking lots, storm drains and waterways.
Cigarette butts and other tobacco product waste don’t clean themselves up.
Public employees do.
Cities spend money sweeping streets, maintaining storm drains, cleaning parks and public spaces, managing litter and keeping waste out of waterways.
That raises another basic taxpayer question:
How much is our community spending because of tobacco product waste?
For municipalities, even relatively small recurring expenses can become substantial when calculated across many years.
That is why communities should be documenting those costs and evaluating available cost-recovery opportunities rather than simply assuming taxpayers must continue absorbing them indefinitely.
Questions Worth Asking Candidates
The next time you attend a candidate forum, town hall or community meeting — or have an opportunity to speak directly with someone seeking public office — consider asking:
Has our community evaluated PFAS exposure at our airport?
Has our fire department reviewed historical AFFF use, fire stations, training facilities and firefighter turnout gear?
Have we evaluated PFAS impacts involving our waterways, wastewater and stormwater systems?
Do we know what these issues have already cost taxpayers?
Do we know what they could cost over the next 10 or 20 years?
How much does our community spend cleaning up tobacco product waste?
Are we documenting those expenses?
Are we investigating legitimate opportunities to recover qualifying costs from responsible parties?
And finally:
If we aren’t doing these things today, why not?
This Shouldn’t Be a Partisan Question
Different candidates will have different views about environmental regulation, litigation, taxation and the role of government.
Those differences are part of elections.
But determining whether a community faces a potentially significant liability should not depend on political affiliation.
Neither should asking whether taxpayers are paying costs that could potentially be recovered elsewhere.
A Republican airport uses firefighting foam.
A Democratic fire department buys turnout gear.
Independent voters use the same rivers and waterways as everyone else.
The underlying question is much simpler:
Is someone paying attention?
Elections Are Also About Stewardship
When we elect someone to public office, we’re giving that person responsibility for more than today’s budget.
We’re entrusting them with public assets that may have to serve a community for generations.
Airports.
Fire departments.
Firefighter safety.
Training facilities.
Waterways.
Wastewater and stormwater infrastructure.
Parks and public spaces.
And taxpayer dollars.
PFAS contamination and tobacco product waste are complicated issues, and candidates don’t need to be environmental scientists or attorneys to discuss them.
But they should be willing to ask questions.
They should be willing to investigate.
And they should be willing to explain how they would protect their community if significant costs are identified.
At Dynamyk Solutions, we believe communities benefit when their leaders identify potential liabilities early, document public costs and investigate legitimate recovery opportunities before simply passing those costs along to taxpayers.
So before the next election, ask your candidates:
What is our community doing about PFAS at our airports, fire departments and waterways?
What are we doing about tobacco product waste?
What could these issues cost our community?
And who is going to pay for it?
Their answers are one more piece of information you can consider when deciding who has earned your vote.
Elections are about more than political labels. They are also about who will protect a community’s water, infrastructure and tax dollars. PFAS contamination and tobacco product waste can create significant long-term costs for local governments. Before casting a ballot, voters should ask candidates a simple question: What are you prepared to do about it?
Why Donors Stop Giving—and What Nonprofits Can Do About It
A donor believes in your mission. They make a gift. What happens next?
Do they receive a meaningful thank-you? Do they learn what their contribution helped make possible? Is there a simple way to give again?
For nonprofits, those questions deserve as much attention as the next fundraising campaign.
The “Why Donors Stop Giving” graphic highlights gaps that organizations can address: gifts going unacknowledged, donors not being asked again, and too little communication about how funds were used. It also points to something familiar to any busy person: sometimes, people simply forget.
The practical takeaway is straightforward. Look closely at the experience you create before, during, and after each gift.

Make the thank-you part of the process
A payment confirmation answers, “Did my donation go through?” A thoughtful acknowledgment answers, “Did my gift matter?”
Build both into your follow-up.
Confirm the donation promptly, then thank the person in language that reflects your organization. When possible, connect their support to the program or purpose they chose.
Assign responsibility for that acknowledgment. A busy week should not leave a generous supporter wondering whether anyone noticed.
Give donors something to hear besides another ask
Between fundraising appeals, share what the work looks like.
A short program update, a photograph shared with appropriate permission, or a concrete milestone can help donors understand where their support fits.
Keep the message specific and accurate. Explain what donations collectively helped accomplish without suggesting that one gift paid for an outcome you cannot substantiate.
Then, when you invite another contribution, connect the request to a clear next step.
Walk through your own giving experience
Open your donation page on your phone and make a small test gift.
Can you find the form? Are the payment choices understandable? Is the total clear before you submit? Does the confirmation arrive?
If you offer recurring giving, check how supporters opt in, update their information, and change or cancel their gift. Review what happens when a scheduled payment fails.
These are useful questions for your fundraising team, donation-platform provider, and processor to work through together. A dependable payment experience supports the relationship your team is building.
Pay attention to what each gift costs to accept
Donor care also means being thoughtful about the resources entrusted to your organization.
Review the full cost of accepting donations: processing charges, platform fees, transaction fees, and monthly expenses. Look at those costs together before judging an advertised rate.
For illustration, reducing total acceptance costs by half a percentage point on $500,000 in annual donation volume would leave an additional $2,500 available to the organization. That is a mathematical example, not a savings estimate or guarantee.
The right question is: Are we paying a reasonable, clearly explained cost for the tools and support we need?
How Mosaic Processing can help
At Mosaic Processing, our nonprofit payment processing review examines how donations move through your organization—from online and event payments to recurring gifts, deposits, and reporting.
We look at processing and platform costs, donor checkout, recurring-payment reliability, and the administrative work behind each payment. Our goal is to identify opportunities for a clearer, better-fitting setup.
Your team builds donor relationships through gratitude, communication, and meaningful work. We help you evaluate whether your payment setup supports those efforts.
Start with the experience you have today
Choose one recent donation and follow it from checkout through acknowledgment and deposit. What did the donor experience? What did your staff need to do? How much reached your organization?
That simple review can reveal useful questions.
Want a clearer picture of your nonprofit’s payment costs and giving experience? Connect with Mosaic Processing for a no-obligation review. Bring your current processing and donation-platform statements, and we’ll help you understand what deserves a closer look.
A donor believes in your mission. They make a gift. What happens next? Do they receive a meaningful thank-you? Do they learn what their contribution helped make possible? Is there a simple way to give again? For nonprofits, those questions deserve as much attention as the next fundraising campaign. The “Why Donors Stop Giving” graphic…

Airport PFAS Claims: A Municipal Guide to Potential Costs and Recovery
Airports may face PFAS-related costs that extend far beyond replacing firefighting foam. For cities, counties, airport authorities, and other public owners, the financial exposure can include historical investigation, soil and groundwater work, apparatus and fixed-system cleaning, foam disposal, regulatory response, and years of monitoring.
The central question is straightforward: What has the airport owner spent—or may reasonably need to spend—because of documented PFAS conditions, and which of those costs may support a legal claim?
This guide explains the principal cost categories, the records that help establish them, and an illustrative way to scale the supplied Raleigh-Durham International Airport estimate for airports of different sizes.
A planning estimate is not an award estimate. Every figure below is a modeling assumption or arithmetic illustration. It is not a vendor quote, established damages amount, settlement offer, or guaranteed recovery. Passenger volume alone does not prove AFFF use, contamination, causation, liability, eligibility, or recoverable damages.
Why airports are a distinct PFAS concern
For decades, many certificated airports maintained aircraft rescue and firefighting capabilities designed for aviation fuel fires. PFAS-containing aqueous film-forming foam, commonly called AFFF, could be stored or used in ARFF vehicles, training exercises, emergency response, hangar systems, calibration, testing, and equipment washdown.
That history can create several possible pathways: direct discharge during an emergency, repeated training releases, leaks or spills from storage, residual material in apparatus and piping, contaminated rinse water, runoff into drainage infrastructure, and migration into soil, groundwater, surface water, or neighboring property.
Past or present military use may add another layer. Active or former military aviation, National Guard or Reserve activity, joint-use operations, federal leases, and property transfers can affect the records, responsible parties, cleanup history, and legal analysis.
The federal AFFF multidistrict litigation, MDL No. 2873, includes allegations that PFAS-containing AFFF contaminated groundwater near airports, military bases, and other sites. Plaintiffs have alleged property damage, personal injury, medical-monitoring needs, and other economic losses. Those allegations do not create a universal airport compensation schedule.
1. Historical records and initial investigation
A credible airport review begins with the operational record. Identify when AFFF was purchased, stored, specified, tested, discharged, replaced, or disposed of. Review ARFF training logs, incident reports, procurement files, hangar-system records, spill reports, safety data sheets, photographs, airport diagrams, drainage plans, and interviews with current and retired personnel.
Initial environmental work may include a conceptual site model, records review, site inspection, sampling design, soil borings, monitoring wells, surface-water or sediment sampling, laboratory analysis, and reporting. The goal is to determine whether a condition exists, where it may have originated, and what additional work is justified.
Illustrative initial-investigation budget: A defined first-phase scope might be modeled at $100,000 to $500,000. That range is only a planning allowance; airport size, suspected release areas, sampling density, access, laboratory methods, and existing data can materially change it.
2. ARFF foam inventory, disposal, and replacement
Moving away from legacy AFFF can involve more than buying new concentrate. Airports may need to characterize inventory, package and transport material, secure appropriate disposal, replace foam, confirm compatibility with ARFF systems, revise procedures, and retrain personnel.
Keep concentrate disposal separate from management of rinsate, contaminated water, soil, or absorbent material. Each waste stream can have different handling requirements and costs.
Illustrative calculation: If an airport has 1,000 gallons of concentrate and uses a hypothetical $30-per-gallon allowance for handling, transport, and disposal, the modeled cost is $30,000. Replacement concentrate at an assumed $40 per gallon adds $40,000, producing a $70,000 planning subtotal. Neither unit price is a quote.
3. ARFF vehicles and mobile equipment
Residual foam may remain in tanks, pumps, proportioning systems, piping, hoses, and valves. A qualified assessment can determine whether cleaning, verification sampling, component replacement, or other work is appropriate.
Illustrative calculation: Six ARFF vehicles multiplied by a hypothetical $25,000 scoped service package equals $150,000. A defensible estimate should state whether the package includes labor, parts, rinse-water management, testing, downtime, and return-to-service verification.
Replacing an entire ARFF vehicle should not be assumed unless the equipment condition, compatibility requirements, or a supported technical assessment justifies it.
4. Hangar systems and fixed infrastructure
Some airports have fixed foam systems in hangars or specialized facilities. Potential costs can include system assessment, concentrate removal, tank and piping cleaning, conversion or replacement, testing, contaminated-water management, and temporary operational measures.
Each building should be treated as a separate asset. Ownership and responsibility may differ among the airport, airlines, fixed-base operators, tenants, military users, and other parties. A lease or operating agreement can be as important as the physical system itself.
5. Training areas, burn pits, and known release locations
Historical ARFF training areas can become major cost centers when evidence supports repeated foam use. Investigation may address soil, groundwater, surface water, sediment, utilities, and off-site migration.
Potential budget components include delineation, excavation, treatment, containment, disposal, engineering, permitting, restoration, and long-term monitoring. A runway-adjacent release area, an older training pad, and a former burn pit may require different remedies.
Illustrative activity-based site model:
| Hypothetical task | Assumption | Illustrative amount |
|---|---|---|
| Initial investigation | Defined scope | $250,000 |
| Soil removal and management | 5,000 tons × $300 | $1,500,000 |
| Engineering and site restoration | Defined scope | $500,000 |
| Monitoring | $100,000 × 10 years | $1,000,000 |
| Modeled subtotal | Before additional groundwater work | $3,250,000 |
This example is not a recommended remedy or market benchmark. It excludes additional groundwater treatment, off-site impacts, escalation, and any work not stated.
6. Drainage, stormwater, surface water, and neighboring property
Airports contain extensive paved surfaces and engineered drainage. A review may need to trace how historical releases moved through inlets, pipes, detention areas, outfalls, ditches, wetlands, streams, or groundwater.
Possible costs include pathway investigation, infrastructure cleaning, sediment management, controls, treatment, restoration, and monitoring. Avoid double-counting a drainage activity already included in a site-remediation estimate.
7. Drinking-water, utility, and wastewater interfaces
An airport’s PFAS condition may intersect with a public water system, private well, wastewater system, landfill, or treatment facility. The airport owner should identify which entity owns each asset and incurred each cost.
Prior public-water settlements do not automatically resolve every airport property claim. Existing settlement participation, releases, exclusions, ownership, and the exact damages asserted require legal review.
8. Compliance, operational disruption, and professional costs
PFAS response can create engineering, legal, consulting, reporting, permitting, procurement, personnel-training, and operational costs. Temporary closures, restricted use of facilities, or ARFF readiness requirements may also affect the budget when supported by records.
Document the reason for each expense and connect it to a defined PFAS response. General airport modernization should not be counted merely because it occurs at the same facility.
Using Raleigh-Durham as an illustrative scaling reference
The supplied Raleigh airport one-pager presents a preliminary estimated range of $26 million to $75.5 million. It does not disclose the underlying damages formula. RDU served approximately 15.6 million passengers in 2025, making it possible to derive a simple passenger-volume reference:
- Low reference: $26 million ÷ 15.6 million passengers ≈ $1.66 per annual passenger
- High reference: $75.5 million ÷ 15.6 million passengers ≈ $4.83 per annual passenger
Applied mechanically, the model produces these examples:
| Annual airport passengers | Illustrative low | Illustrative high |
|---|---|---|
| 500,000 | $0.83M | $2.42M |
| 1 million | $1.66M | $4.83M |
| 2.5 million | $4.15M | $12.08M |
| 5 million | $8.30M | $24.15M |
| 10 million | $16.60M | $48.30M |
| 15.6 million | $25.90M | $75.35M |
| 25 million | $41.50M | $120.75M |
| 50 million | $83.00M | $241.50M |
This is a communications and triage model, not a valuation method. Passenger count is a proxy for airport scale, not contamination. A smaller former military airport with repeated AFFF training and documented groundwater impacts could face greater costs than a larger airport with limited releases. Cargo activity, acreage, ARFF index, number of vehicles, hangar systems, years of use, hydrogeology, affected receptors, and prior cleanup can materially change the result.
The model should therefore be used to identify airports that warrant review, followed by an evidence-based, asset-by-asset cost ledger.
A hypothetical combined airport budget
The following example shows how documented cost categories can be assembled without relying solely on passenger volume:
| Cost category | Illustrative budget |
|---|---|
| Initial investigation | $300,000 |
| AFFF disposal and replacement | $70,000 |
| Six ARFF vehicle service packages | $150,000 |
| Training-area site work and monitoring | $3,250,000 |
| One fixed-system assessment and conversion allowance | $750,000 |
| Drainage and outfall investigation | $400,000 |
| Illustrative combined budget | $4,920,000 |
This calculation excludes unscoped groundwater treatment, additional hangars, off-site impacts, legal fees, financing, escalation, and other expenses. It demonstrates budgeting mechanics, not expected legal recovery.
Records airport owners should gather
- Ownership and agreements: deeds, leases, tenant agreements, military-use records, joint-use agreements, and federal transfer documents.
- AFFF history: procurement records, specifications, inventories, safety data sheets, disposal records, training logs, incident reports, and spill documentation.
- Assets: ARFF vehicle records, hangar-system files, tank and piping diagrams, maintenance logs, and conversion plans.
- Environmental evidence: site assessments, sampling data, well records, drainage maps, remediation documents, and regulatory communications.
- Financial evidence: invoices, scoped quotes, grants, insurance, capital plans, normal replacement schedules, and documented operational impacts.
- Legal history: settlement participation, notices, releases, claims, existing representation, and applicable deadlines.
Coordinate document and product preservation with counsel before discarding potentially relevant evidence. Operational and safety decisions should proceed with appropriate technical guidance.
From an initial review to a potential claim
Bring airport leadership, finance, environmental staff, ARFF, facilities, engineering, risk management, and counsel into the same review. Build a timeline of AFFF use, map the potentially affected assets, identify evidence gaps, and obtain scoped estimates.
Counsel can then evaluate the proper claimant, responsible parties, applicable law, deadlines, prior settlements or releases, and the proof required for each category. Where military or tenant operations are involved, responsibility and cost allocation may require additional analysis.
The strongest starting point is a documented cost ledger tied to actual airport assets and environmental evidence. Passenger volume can help frame an initial conversation, but the claim must ultimately rest on the airport’s own history, property, costs, and proof.
To discuss an initial airport PFAS review:
Scott Bauer
scottb@davidgrossmanandassociates.com
847-494-4598
Attorney Advertising. General educational information, September 2026; not legal advice. Eligibility, claims, defendants, deadlines, and recoverable damages depend on the facts and applicable law. Prior results do not guarantee a similar outcome. Contacting the firm does not create an attorney-client relationship.
PFAS-related airport costs can extend across ARFF foam, vehicles, hangar systems, training areas, drainage, groundwater, disposal, and long-term monitoring. This municipal guide explains the major cost categories and uses Raleigh-Durham International Airport as a transparent reference for preliminary airport-size estimates—while showing why actual recovery depends on each airport’s records, contamination evidence, ownership, and applicable law.

PFAS and Fire Departments: A Municipal Guide to Potential Claims, Costs, and Recovery
For a city, town, village, or fire district, the financial impact of PFAS can extend across equipment, public property, environmental response, and future operating budgets. A review that stops at the foam stored on a fire engine may overlook costs associated with training grounds, protective clothing, drainage systems, and contaminated materials.
The practical question is: What has the municipality spent—or may reasonably need to spend—because of documented PFAS-related conditions, and which of those costs may support a legal claim?
This guide explains the principal categories to investigate and shows how to build an initial cost model. The examples describe hypothetical departments, not a particular municipality.
A planning estimate is not an award estimate. Every dollar figure below is an expressly stated modeling assumption or arithmetic illustration. None is a vendor quote, established damages amount, settlement offer, or guaranteed recovery. Eligibility, causation, recoverability, deadlines, and potential offsets require claim-specific legal review.
Start with the difference between costs and claims
A department may have a legitimate operational reason to replace equipment or investigate a site. That does not automatically mean every expense can be recovered from a manufacturer or another party.
A useful review follows three steps: identify the affected product or property; document the resulting expense or reasonably supported future need; and determine whether an available legal theory connects that loss to a responsible party. Ordinary replacement costs, unrelated improvements, duplicated expenses, and unsupported future allowances should be separated from potentially attributable losses.
The federal AFFF litigation illustrates the breadth of issues under review. The court describes allegations involving groundwater contamination and claims for personal injury, medical monitoring, property damage, and other economic losses. These are allegations being litigated, not a universal compensation schedule for fire departments. Source: U.S. District Court, AFFF MDL 2873.
1. Turnout gear and other protective equipment
Begin with an inventory of the actual personnel who require protective gear. Include qualified cross-trained public-safety personnel and reserve inventory where appropriate; do not assume that every employee needs a structural firefighting ensemble.
Record manufacturer, model, purchase date, components, condition, remaining service life, and available information about PFAS content. A replacement assessment should define exactly what a “set” includes. Coat and pants, a complete protective ensemble, and a broader equipment package are different scopes and should not share an unexplained unit price.
Potential expense categories for review include accelerated replacement of affected items, necessary sizing and fitting, documented spare inventory, testing, and appropriate handling of retired equipment. Counsel should assess whether and how these expenses could be claimed, including the effect of normal replacement schedules and the remaining useful life of existing items.
A transparent gear calculation
The supplied planning materials use $20,000 per set, one or two sets per person, and a 10% reserve. That unit cost has not been independently established as a market price for turnout clothing. It is retained here solely to show how the supplied model works; actual purchasing quotes and a component-level scope should replace it.
Planning budget = eligible gear users × sets per user × assumed cost per set × reserve factor.
| Hypothetical gear users | One set each, plus 10% | Two sets each, plus 10% |
|---|---|---|
| 50 | $1,100,000 | $2,200,000 |
| 100 | $2,200,000 | $4,400,000 |
| 250 | $5,500,000 | $11,000,000 |
| 500 | $11,000,000 | $22,000,000 |
For example, 100 users × two sets × $20,000 = $4 million, with a $400,000 reserve bringing the modeled procurement budget to $4.4 million. That calculation establishes the result of the assumptions; it does not establish the assumptions’ reasonableness or a recoverable loss.
Price sensitivity matters. If a hypothetical, like-for-like quoted package were $5,000 instead, the same 100-user, two-set model with a 10% reserve would equal $1.1 million. The $5,000 figure is also an arithmetic assumption, not a quoted market price. A sound claim starts with the actual package and invoice evidence.
2. Remaining AFFF inventory and foam transition
A review should identify stored foam concentrates, containers carried on apparatus, fixed systems where applicable, and legacy inventory at training sites. Purchasing records can establish acquisition or specified carriage. They do not, by themselves, prove discharge or environmental contamination.
Potential cost items to document include inventory characterization, appropriate packaging, transport and disposal, replacement foam, compatible equipment adjustments, and necessary training. Distinguish disposing of existing concentrate from treating contaminated rinse water or excavated soil.
Illustrative calculation: assume 500 gallons of concentrate and a hypothetical all-in handling, transport, and disposal allowance of $30 per gallon. That produces $15,000. If replacement concentrate is separately modeled at $40 per gallon, another $20,000 is added, for a $35,000 planning subtotal. Actual waste acceptance, minimum charges, container condition, foam specifications, and equipment compatibility may materially change the result.
EPA’s 2026 guidance discusses destruction and disposal options for PFAS-containing materials and associated scientific uncertainties. It is nonbinding guidance, not a universal disposal price or a guarantee that any method is appropriate for every waste stream. Source: EPA, PFAS destruction and disposal guidance.
3. Apparatus and equipment decontamination
Replacing foam does not necessarily resolve residues within equipment that previously held it. A qualified assessment can address tanks, proportioning systems, piping, pumps, hoses, and associated components.
Document the scope of inspection, cleaning procedures, collected rinse water, analytical verification where appropriate, components requiring replacement, and necessary downtime. Do not presume that every engine needs replacement or that an entire vehicle’s value is attributable to PFAS.
Illustrative calculation: eight affected vehicles × a hypothetical $25,000 scoped service allowance = $200,000. The quote must specify whether this includes labor, parts, waste handling, testing, and return-to-service checks. Otherwise, those items can be unintentionally counted twice.
4. Training grounds and historical foam-use locations
A current or former training center may warrant a separate review of historical activities, ownership, drainage, nearby receptors, and environmental conditions. The presence of a training tower alone does not establish AFFF use or contamination.
Investigation can progress from records and interviews to an appropriately designed sampling program and, if justified, a remedy assessment. Potential budget components include soil, groundwater, surface-water or sediment sampling; laboratory analysis; delineation; engineering; contaminated-material management; treatment or containment; restoration; and ongoing monitoring.
The supplied materials use a $15 million allowance per training center. That is a scenario assumption, not an established per-site remediation cost. It should never be multiplied by the number of training centers and presented as an expected award.
For a hypothetical 100-person department, the supplied two-set gear model with reserve is $4.4 million. Adding one $15 million site allowance gives a $19.4 million illustrative planning scenario. Without site evidence, a defined remedy, and a legal analysis, the site component remains unsubstantiated.
Build a site estimate from quantities
A more useful early model identifies activities and measurable quantities. For arithmetic illustration only:
| Hypothetical task | Assumption | Illustrative amount |
|---|---|---|
| Initial investigation | Defined scope allowance | $100,000 |
| Soil removal and management | 2,000 tons × $300 per ton | $600,000 |
| Site restoration | Defined scope allowance | $150,000 |
| Monitoring | $40,000 annually × 10 years | $400,000 |
| Modeled subtotal | Before additional scope or adjustments | $1,250,000 |
This example is not a recommended remedy or a low-end price benchmark. It excludes any additional groundwater treatment, off-site impacts, permitting, escalation, and other work not stated. The monitoring calculation is undiscounted. Conditions could require a very different approach and budget.
5. Runoff, drainage, waterways, and neighboring property
A fire-department review may need to extend beyond the station or training-site boundary. Investigators can evaluate whether documented releases affected drainage infrastructure, retention areas, sediment, groundwater, or adjacent property.
Costs to examine may include tracing pathways, sampling, cleaning affected infrastructure, managing contaminated sediment, designing controls, and monitoring. Ownership and legal responsibility matter: the municipality, airport authority, water utility, county, and private landowner may have different interests.
For example, a historical foam-use area and an adjacent drainage ditch may be part of one connected investigation. Listing a $500,000 drainage allowance both inside the training-site estimate and again under public works would overstate the combined budget. Use one master cost ledger and identify which entity incurred each expense.
6. Stations, storage, and waste-management practices
Where evidence supports a concern, review foam storage areas, spills, equipment wash areas, and the handling of retired materials. These issues may create investigation, cleaning, disposal, or operational costs distinct from the outdoor training ground.
Separate documented corrective work from general station modernization. An unrelated renovation is not converted into a PFAS loss simply because it occurs at the same building. Record why each activity is necessary and how its scope relates to the identified condition.
7. Long-term monitoring and supported future costs
A one-time capital estimate can miss recurring sampling, maintenance, treatment-media replacement, reporting, or waste-management expenses. Where a defined response plan supports them, model those items separately from initial construction.
Illustrative calculation: $50,000 per year for 20 years equals $1 million before inflation or discounting. A litigation damages model may require a supported duration and present-value treatment; a capital plan may use a different presentation. Explain which method is being used.
Do not add a blanket future-cost percentage to expenses already included in a contractor’s life-cycle estimate. Label contingencies separately from known expenditures.
Individual firefighter claims require a separate analysis
A municipality’s equipment and property claims should not be combined casually with individual firefighters’ personal-injury or medical-monitoring claims. The claimant, evidence, legal standards, and damages are different.
Personnel count is useful for a gear inventory. It is not a reliable method for estimating personal-injury recovery. The existence of PFAS-related litigation does not establish that a particular person has a compensable injury or that the municipality can recover an employee’s individual damages.
What a defensible combined budget looks like
The following example combines only the explicitly scoped assumptions above for a hypothetical 100-person department. It uses the activity-based site example rather than adding the separate $15 million site allowance.
| Cost category | Illustrative budget |
|---|---|
| Two gear sets per user, including 10% reserve | $4,400,000 |
| Concentrate disposal and replacement | $35,000 |
| Eight apparatus service packages | $200,000 |
| Site investigation, soil work, restoration, and 10-year monitoring | $1,250,000 |
| Illustrative combined budget | $5,885,000 |
This total assumes that the apparatus packages do not include the separately listed bulk concentrate costs and that no site work overlaps. It excludes unscoped station work, additional runoff impacts, legal fees, financing, and other expenses. It is a demonstration of budgeting mechanics, not a forecast of legal recovery.
The records municipalities should gather
- Product history: foam and gear invoices, manufacturers, models, safety data sheets, purchase specifications, inventories, and disposal records.
- Use history: training logs, incident reports, known releases, spill records, photographs, and interviews with current and retired personnel.
- Property information: ownership and lease records, site maps, drainage plans, prior investigations, and relevant airport or shared-facility agreements.
- Financial evidence: paid invoices, scoped vendor quotes, grant or insurance funding, normal replacement schedules, and documented operating impacts.
- Legal history: existing representation, filed claims, settlement notices, releases, and other agreements that may affect available claims.
Coordinate preservation with municipal counsel before disposing of potentially relevant records or products. Safety-driven handling and operational decisions should proceed with appropriate professional guidance while relevant evidence is documented.
From an initial review to a potential claim
Bring the fire chief, finance team, public works or environmental staff, and municipal counsel into the same discussion. Start with a shared inventory of affected assets and known expenses. Identify evidence gaps, obtain scoped estimates, and separate actual spending from contingent future work.
Counsel can then assess the appropriate claimant, responsible parties, applicable law, filing deadlines, prior releases, and the proof needed for each category. A water-system settlement does not by itself answer whether a separate fire-department issue remains actionable; its terms and the particular claim must be reviewed.
The goal is to give municipal leaders a credible account of the financial burden and a supported basis for evaluating recovery. The strongest starting point is a documented cost ledger—not a headline number derived solely from population, firefighter count, or acreage.
To discuss an initial municipal PFAS review:
Scott Bauer
scottb@davidgrossmanandassociates.com
847-494-4598
Educational information, September 2026. Planning methodology draws on the supplied fire-department examples. All hypothetical figures require validation against local inventory, actual quotes, environmental evidence, and legal requirements. No outcome is promised.
PFAS-related costs can reach far beyond replacing firefighting foam. Learn how municipalities can evaluate turnout gear, apparatus decontamination, training grounds, runoff, disposal, and long-term monitoring—with practical examples that distinguish planning budgets from potential legal recovery.

Your Processing Statement Is Full of Numbers. Our Cost Comparison Makes Them Useful.
Most business owners know how much revenue they generate. Far fewer can explain exactly how much they pay to accept credit cards—or where those costs come from.
That is understandable.
Merchant processing statements are rarely designed for clarity. Interchange, card-brand assessments, processor markup, authorization fees, batch fees, regulatory charges, gateway expenses, and other costs are often grouped together in ways that make it difficult to understand what is necessary, what is negotiable, and what may be excessive.
At Mosaic Processing, we believe businesses deserve more than a rate quote. They deserve a clear comparison based on their actual processing activity.
That is why we created our Processing Cost Comparison.
More Than a Quote
Many processing proposals begin with an advertised rate. That rate may sound attractive, but it rarely tells the entire story.
A low percentage can be offset by higher transaction fees, monthly charges, equipment expenses, gateway fees, or other costs. In some cases, the proposal is based on assumptions that do not reflect how the business actually accepts payments.
Our comparison starts with the merchant’s real statement.
We review actual processing volume, transaction count, average ticket, card mix, current fees, and other relevant activity. We then organize that information into a straightforward side-by-side analysis of the current provider and the proposed Mosaic Processing solution.
Instead of asking a business owner to interpret pages of complicated statement data, we show the information in a format that answers the questions that matter:
- What are we paying today?
- Which costs are established by the card networks?
- How much is our processor charging?
- Are there unnecessary or inflated fees?
- What would our estimated monthly cost be with Mosaic?
- How would the change affect our effective rate?
- What could the estimated annual and three-year savings look like?
The result is a financial decision based on evidence—not a sales pitch.
We Separate the Costs That Cannot Be Changed From the Costs That Can
One of the most important parts of our comparison is separating interchange and card-brand costs from processor-controlled pricing.
Interchange and card-brand fees are generally established by networks such as Visa, Mastercard, Discover, and American Express. Switching processors does not make those underlying costs disappear.
Processor markup is different.
The processor determines its markup, transaction fees, monthly charges, and many of the additional costs that appear on a merchant’s statement. Those are the areas where a better pricing structure may create meaningful savings.
Our analysis clearly separates these categories. We do not pretend that every dollar paid to the current provider is available as savings. We identify the specific areas where pricing can realistically improve.
That transparency makes the comparison more credible—and more useful.
The Effective Rate Tells a Bigger Story
One of the clearest measurements in payment processing is the effective rate.
Total processing costs ÷ total processing volume = effective rate
A merchant processing $100,000 in monthly card volume and paying $2,750 in total fees has an effective rate of 2.75%.
This number includes more than an advertised percentage. It reflects the combined impact of interchange, processor markup, transaction charges, monthly fees, and other statement costs.
Our comparison shows the merchant’s current effective rate alongside the estimated rate under Mosaic’s proposal. That allows the business to evaluate the full cost—not one attractive number selected from a much larger pricing structure.
We Show Where the Difference Comes From
Savings projections are only valuable when a merchant can see how they were calculated.
Our Processing Cost Comparison breaks expenses into recognizable categories, which may include:
- Interchange and card-brand pass-through costs
- Processor markup
- Authorization fees
- Batch fees
- Monthly or regulatory charges
- Per-item transaction fees
- Gateway or virtual-terminal costs
- Other recurring processing expenses
We then show the current cost, the Mosaic estimate, and the difference for each category.
If the comparison projects $200 in monthly savings, the merchant should be able to see exactly which pricing changes produced that number. We also translate the monthly estimate into annual and three-year projections to demonstrate the potential long-term impact.
These projections are based on the activity shown in the statements provided. Actual results may change as sales volume, average ticket, card mix, transaction methods, or network pricing changes—but the underlying analysis remains transparent.
Card Mix Matters
Not every transaction costs the same amount.
A rewards credit card, regulated debit card, corporate card, keyed transaction, and online payment may each carry different underlying costs. A generic rate quote can overlook those differences.
Our comparison considers the merchant’s actual processing profile and can show pricing by card brand. This helps the business understand:
- How processor markup applies across different card types
- Whether per-item fees remain consistent
- Where basis-point reductions may create savings
- How the business’s average ticket affects total cost
- Whether the proposed pricing structure fits the way customers actually pay
This is especially important for businesses with higher transaction counts, larger average tickets, seasonal volume, multiple locations, or a mix of in-person and online payments.
The Technology Matters Too
Price is important, but it is not the only part of a processing decision.
A business still needs tools that support its daily operations. Depending on the merchant’s needs, that may include a virtual terminal, online reporting, transaction search, refunds, recurring payments, invoicing, multiple users, or other payment capabilities.
Our comparison can include the tools being proposed so the merchant understands both the financial and operational sides of the decision.
Saving money is valuable. Saving money while gaining better visibility and functionality is even more valuable.
Why Our Comparison Is Different
A processor can always produce a quote. We want to provide something more useful: a document a business owner, CFO, controller, or finance team can independently review and understand.
Our comparison is different because it is:
Based on Actual Activity
We use recent processing statements instead of relying on broad estimates or hypothetical transaction patterns.
Transparent
We separate card-network costs from processor-controlled pricing, so the merchant can see what is—and is not—changing.
Easy to Verify
The important figures are displayed side by side. Merchants can trace the comparison back to their existing statement.
Focused on Total Cost
We evaluate the overall expense and effective rate rather than highlighting a single promotional percentage.
Specific to the Business
The analysis reflects actual volume, average ticket, transaction count, card mix, and processing needs.
Designed for Decision-Makers
The final document turns complicated statement data into a clear financial overview that can be shared with owners, partners, finance teams, boards, and other stakeholders.
A Useful Review—Even If You Do Not Switch
A processing cost comparison can provide value even when a business decides to remain with its current provider.
It may uncover fees that deserve clarification. It may help the merchant renegotiate its current agreement. It may reveal that the existing pricing is competitive. It may also identify technology, reporting, or service limitations that have nothing to do with rates.
The purpose is not to force a change. The purpose is to give the business the information required to make a confident decision.
Sometimes the analysis reveals substantial savings. Sometimes the opportunity is smaller. Either way, the merchant receives a clearer understanding of one of its recurring operating expenses.
Clarity Creates Better Decisions
Payment processing is often treated as a necessary cost that is too complicated to examine closely. But even modest monthly improvements can become meaningful over a year—or several years.
More importantly, businesses should understand where their money is going.
At Mosaic Processing, our goal is to explain processing in plain language, identify realistic opportunities, and build recommendations around each client’s actual operation.
No mystery. No carefully selected teaser rate. No estimate disconnected from the merchant’s real activity.
Just a clear comparison, transparent pricing, and the information needed to decide with confidence.
Request Your Processing Cost Comparison
If you want to understand what your business is actually paying, send us two to three recent processing statements.
We will review your current costs, calculate your effective rate, identify the processor-controlled fees, and prepare a side-by-side comparison based on your actual activity.
There is no cost, no commitment, and no obligation to switch.
A few minutes and a few statements may be all it takes to understand whether your current processing arrangement is truly working for your business.
Contact Mosaic Processing to start your complimentary Processing Cost Comparison.
Always Accessible: Why Real Support Matters in Payment Processing
Payment processing is easy to overlook when everything is working. Customers pay. Transactions are approved. Deposits arrive. The business continues operating. But when something goes wrong, payment processing immediately becomes one of the most important parts of the business. A terminal stops working during the busiest part of the day. A deposit does not arrive when expected. Transactions begin declining without an obvious explanation. A merchant receives a concerning notice about its account, or a question arises about a fee, refund, or chargeback. In those moments, businesses do not need another automated response. They need a real person who understands the issue, knows their business, and is willing to help. That is why one of our core values at Mosaic Processing is Always Accessible. When our clients need us, they should be able to reach knowledgeable people. Responsive, proactive communication is not an extra service. It is a basic expectation of the partnership.
Access to Support Is Part of the Payment Solution
Payment processing is often evaluated based on price, technology, and features. Those things matter. But support should be considered part of the solution too. A competitive rate loses much of its value if the merchant cannot reach anyone when an important deposit is delayed. Advanced technology is not very helpful if employees cannot get assistance when the equipment stops working. A payment provider may look great on paper and still leave a business feeling completely alone when a problem arises. That is not good enough. Businesses trust their payment partners with a critical part of their operations. They deserve to know who they can contact, how to reach them, and what kind of response they can expect. Support should never become visible only after something goes wrong. It should be built into the relationship from the beginning.
Real People Create Better Support
Automated tools can be useful. They can answer simple questions, provide documentation, display transaction information, and help resolve routine issues efficiently. But automation cannot replace human judgment. When a business is experiencing a serious processing problem, the situation may involve multiple systems, providers, or decisions. The merchant may not know whether the issue comes from the terminal, POS, gateway, processor, bank, card network, or customer’s issuing institution. Being directed through a series of automated prompts does not solve that confusion. A knowledgeable person can ask questions, understand the urgency, identify the right next step, and explain what is happening. Even when the answer is not immediate, a real person can take ownership of the issue and keep the client informed. Technology should make support more efficient. It should not become a barrier between businesses and the help they need.
Knowing the Client’s Business Matters
There is a meaningful difference between speaking with someone who can locate an account and speaking with someone who understands the business behind it. A support representative may be able to see transaction volume and account information. But strong support requires more context. How does the company accept payments? Which equipment, gateway, or POS does it use? Does it operate online, in person, or across multiple channels? Is the business seasonal? Are deposits especially time-sensitive? Does the company have unique underwriting, chargeback, or reporting needs? When the person helping already understands that context, the conversation becomes faster and more productive. The client does not need to begin every call by explaining the entire business from the beginning. At Mosaic Processing, we want our relationships to be close enough that clients feel known. They are not simply merchant identification numbers or tickets in a queue. They are businesses with employees, customers, responsibilities, and goals. The better we know them, the better we can support them.
Responsiveness Is More Than Returning a Call
Being accessible does not mean we will always have an instant answer. Payment processing involves banks, card networks, gateways, technology platforms, underwriting teams, and other organizations. Some issues require investigation, documentation, or coordination with outside partners. What we can provide immediately is acknowledgment, ownership, and communication. Clients should not have to wonder whether their message was received. They should not need to follow up repeatedly just to learn that an issue is still being reviewed. Even when the final answer takes time, communication should not disappear. A responsive partner confirms the problem, explains what is being done, sets realistic expectations, and continues providing updates until the issue is resolved. Silence creates uncertainty. Communication creates confidence.
Proactive Communication Is Even More Valuable
The best support does not always begin with a client asking for help. Sometimes the payment partner should initiate the conversation. A meaningful industry change may affect the client’s costs, compliance responsibilities, dispute exposure, or account stability. The business may be approaching a processing threshold, experiencing an unusual pattern, or using technology that no longer fits its needs. Waiting until the client discovers the issue may mean waiting too long. We believe proactive communication is part of being accessible. If we see something that deserves attention, we want to raise it. If an industry development could affect a client, we want to explain it clearly. If a better option becomes available, we want to discuss whether it creates real value. Not every update requires action, and clients should not be overwhelmed with unnecessary information. Our responsibility is to identify what matters, explain why it matters, and help the client determine the right response.
Accessibility Matters Most When the Stakes Are High
A processing problem is rarely just a technical inconvenience. If customers cannot pay, the business may lose revenue. If deposits are interrupted, payroll, inventory, or other obligations may be affected. If a merchant account is placed under review or terminated, the company’s ability to operate could be at risk. That is why accessibility must be more than a marketing promise. During a high-stakes situation, clients need someone willing to listen, investigate, escalate, and advocate. We may not control every decision made by a bank, card network, or technology provider. We cannot promise that every issue will have the outcome a client wants. But we can promise to take the concern seriously, communicate honestly, and help the client understand the available options. Sometimes the most important value a payment partner provides is simply making sure the business does not have to navigate a difficult situation alone.
Accessibility Requires Accountability
It is possible to be easy to reach without being helpful. Real accessibility requires accountability. That means following through on commitments. It means documenting important information, coordinating with the right partners, and making sure the client receives an answer. If an issue needs to be escalated, we should help move it forward. If additional documentation is required, we should explain what is needed and why. If the answer is not what the client hoped for, we should communicate it directly. Clients should not be passed endlessly between departments while no one takes responsibility. The person receiving the concern may not personally control every step of the resolution, but someone should own the communication. Accessibility without ownership creates frustration. Accessibility with accountability builds trust.
Support Should Continue After the Sale
Too many business relationships change once the agreement is signed. Before the sale, communication is frequent. Questions are answered quickly. The merchant knows exactly whom to contact. After implementation, that attention can disappear. At Mosaic Processing, we believe onboarding is the beginning of the relationship—not the end of it. Clients will continue to have questions as their businesses evolve. They may add locations, introduce e-commerce, purchase new equipment, change their POS, increase transaction sizes, or enter new markets. The payment solution may need to evolve with them. Staying accessible allows us to understand those changes and help clients make informed decisions before their existing setup becomes a limitation. We want clients to contact us when there is a problem, but we also want them to reach out when there is an opportunity.
Accessibility Creates Stronger Partnerships
Business owners do not expect perfection. They understand that technology can fail, financial systems can experience delays, and complicated issues may take time to resolve. What they expect is honesty, urgency, and communication. They want to know that their concern matters. When a client can reach someone who knows the business, understands the issue, and communicates consistently, the relationship becomes stronger—even during a difficult situation. That trust cannot be created by a support script. It is created through repeated actions: answering, following up, explaining clearly, and being present when the client needs help.
The Mosaic Difference
At Mosaic Processing, accessibility is part of how we define partnership. Our clients should know who they are working with. They should have real people they can contact and confidence that their questions will be taken seriously. We use technology where it improves efficiency, but we do not hide behind it. We communicate proactively when we see something that deserves attention. We provide updates when an issue requires time. We explain complicated situations in plain language and help clients understand their next steps. Always Accessible does not mean promising that every problem can be resolved immediately. It means clients will not be left wondering who is helping, what is happening, or whether anyone cares. Payment processing is too important for businesses to navigate alone. If you are tired of calling generic support lines, repeating your story to a different person every time, or waiting without an update, it may be time for a different kind of payment relationship. At Mosaic Processing, you are not just an account. You are a partner—and when you need us, we are here.